Commercial real estate markets are entering the new year relatively stuck. Through the first three quarters of 2023, property sales and mortgage origination volumes are each down fifty-plus percent compared to the year prior. Questions about some properties’ fundamentals, about where property values sit and about where interest rates may go from here have led to many participants sitting on the sidelines – waiting for greater clarity and perhaps more favorable conditions.
As 2024 begins, the year ahead should bring some of that clarity. For property fundamentals, we should expect to learn more about which properties -- particularly in the office market -- are more (and less) affected by supply/demand imbalances. Property values should also come into greater focus. And the drop in long-term interest rates in recent months may bring some relief to both cap rates and financing costs, at least in comparison to when Ten-year Treasury yields ranged around 5 percent in October of 2023.
Maturing mortgages will also bring greater clarity – and force the issue for many owners. Many maturing loans have and will refinance easily – providing new “marks” for the market. But delinquency rates rose for some loan types during 2023, with office properties leading the way. Maturing loans that have difficulty refinancing at terms the borrower hopes for, as well as loans that are facing challenges during their terms, may end up being another key to unsticking the markets.
ECONOMY
The U.S. economy has seemingly been moving in all the right directions. Inflation has been cooling enough to shift the Fed’s gaze from continued increases in short-term rates to (eventual) decreases. The labor market is cooling – such that the number of open positions has dropped to the lowest level since April 2021 and wage growth is at its lowest rate since June 2021 – but the unemployment rate is a still strong 3.7 percent and real wage growth is in positive territory. Consumers remain resilient, with retail sales in October 2.8 percent higher than a year-earlier and personal consumption expenditures adding 2.4 percentage points to Q3’s 4.9 percent growth in real GDP.

The recent softening in posture by the Federal Reserve has brought interest rates down significantly. The Ten-year Treasury yield averaged 4.8 percent in October 2023 but fell to 3.9 percent in mid-December. The Two-year Treasury yield averaged 5.1 percent in October but fell to 4.5 percent.
The Federal Reserve often notes that their actions come with “long and variable lags,” meaning that many impacts of the tight monetary policy of their elevated Feds Fund Rate may still be ahead of us. Tied to that, the FDIC’s Senior Loan Officer Opinion Survey from the Third Quarter shows a tightening of credit and – perhaps more significant – a fall-off in demand for loans that together challenge conditions seen at the onset of the pandemic and the Great Financial Crisis.

Where the economy goes from here will flow through to commercial real estate through property fundamentals, valuations, interest rates and a variety of other pathways.
CRE FUNDAMENTALS
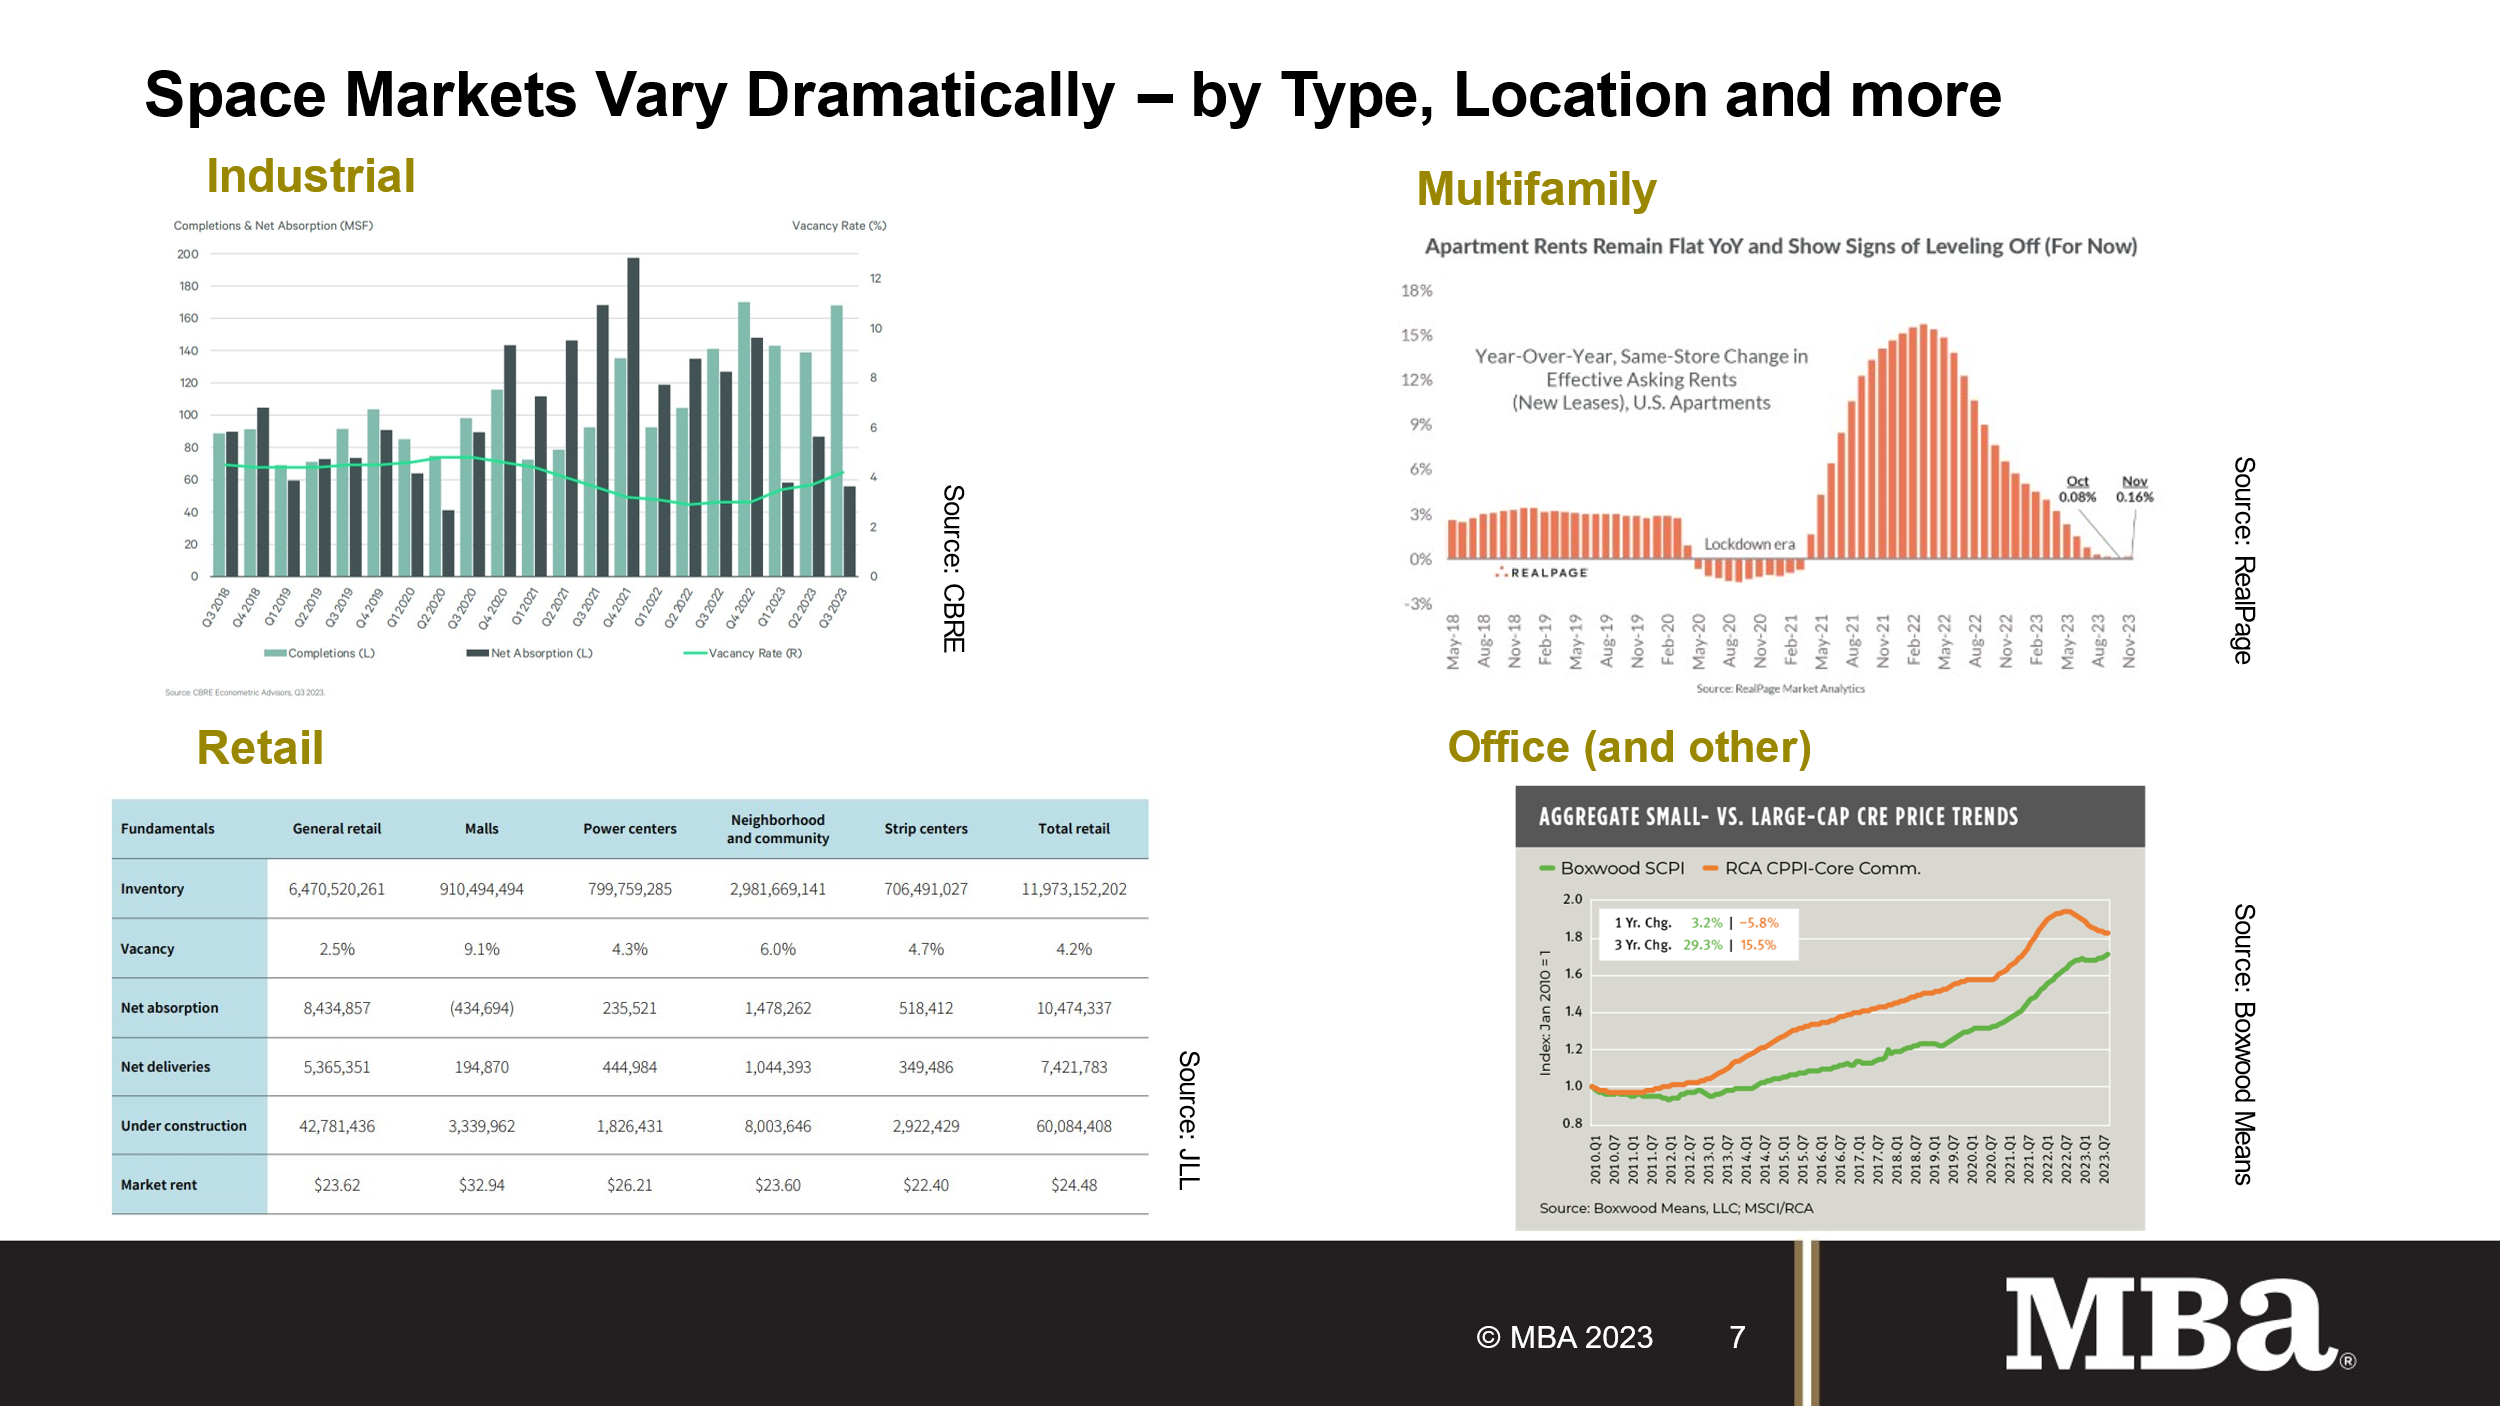
The foundation of commercial real estate is the demand for and supply of space – whether apartments, offices, retail, logistics or for other uses.
Office
Going into 2024, most eyes are on office properties, and how hybrid work will or will not affect demand for space. A recent study by CBRE found a 22 percent decline in the average square foot per person globally and a 28 percent increase in the number of people per seat. A full 43 percent of organizations plan to decrease their space by more than 30 percent over the next three years. With these changes, market participants are working to identify which properties will be more and less impacted. An earlier study found that the hardest hit buildings tend to be those in central business districts, and that age is less determinative, and quality more, of properties that continue to perform well.
Retail
After a number of years in the wilderness, retail has become one of the steadier CRE property types. According to JLL, “Retail real estate is experiencing a significant shortage of available space, due to limited new deliveries and 145 million square feet demolished in the last five years. The availability rate is nearly 200 basis points below its historical average of 6.8%.” There is significant differentiation between types of retail space. General purpose retail buildings are seeing the greatest demand, while some malls continue to see negative net absorption. Quick service restaurants and food and beverage are leading the pack in demand.
Industrial & Multifamily
The multifamily and industrial sectors have been buoyed in recent years by surging demand in the face of limited supply. Adhering to the physics of CRE, vacancy rates tightened and rent growth took off. Investment dollars followed. Not surprisingly, developers then responded and new supply is now outstripping new demand, moderating rents.
Prologis kicked off their Third Quarter earnings conference call summarizing the industrial space market like this: “growing supply translating to increased market vacancy, continued moderation of demand, and market rent growth that will slow until the low levels of new starts drive reduced availability over time.” They also noted that vacancy rates remain historically very low and that, while slowing, they expect rent growth to remain positive.

A similar story is playing out in multifamily markets. After falling to near all-time lows in 2021 (6.4%) multifamily rental vacancy rates have been ticking higher – hitting 7.9 percent in Q3 2023. Asking rent growth, which had been well in the double-digits, has slowed to flat in recent months. The impact of new construction is likely to linger as there are currently one million multifamily units under construction – the most on record. Permitting and starts remain elevated but have fallen from levels seen in 2021 and 2022.

SALES ACTIVITY AND VALUES
Sales transaction volumes have been subdued as market participants sort through questions about some property’s fundamentals, where values are and volatile – and what are perceived as high – interest rates. That lack of activity is, in turn, obscuring where property values sit.
Through October 2023 sales transaction volumes are 56 percent lower than they were a year earlier. The drop in activity is across property types – with apartment volumes down 64 percent, office down 61 percent, hotel down 52 percent, industrial down 50 percent and retail down 41 percent.

Different measures tell different stories about how property values are (or are not) holding up. A price series from Green Street Advisors shows CRE property values down 16 percent from their recent highs. Real Capital Analytics CPPI records a 10 percent drop and a series used by the Federal Reserve shows prices roughly flat – but also didn’t record the same level of price rise during 2021 and 2022 as the other series.

Most series show cap rates increasing but the pace lags the growth in broader interest rates that many look to as a base comparison. RCA reports apartment cap rates have grown from 4.5 percent at the start of 2022 to 5.2 percent in the third quarter of 2023. Industrial cap rates rose from 5.1 percent to 5.9 percent, retail from 6.1 percent to 6.6 percent and office from 6.1 percent to 6.9 percent. The models MBA uses as part of our CREF forecast would expect a more substantial rise, but the lack of transaction activity and the fact that many potential sellers are holding on in hopes of lower interest rates further clouds the situation.

MORTGAGE ORIGINATIONS
Borrowing backed by commercial real estate properties declined again in the third quarter. Borrowing and lending were down for every property type and capital source from one year ago. However, compared to this year’s second quarter, volumes were more stable, and some sectors – including industrial properties and life company lenders – showed an uptick in volume.

Year-to-date CRE mortgage borrowing has fallen 53 percent, driven by questions about some properties’ fundamentals, uncertainty about property values, and higher and volatile interest rates. Greater certainty around those conditions is a key prerequisite to breaking the logjam of transaction activity.
Commercial mortgage loan originations were 49 percent lower in the third quarter of 2023 compared to a year ago and decreased 7 percent from the second quarter of 2023.
Decreases in originations for all major property types led to the overall drop in commercial/multifamily lending volumes when compared to the third quarter of 2022. There was a 76 percent year-over-year decrease in the dollar volume of loans for health care properties, a 52 percent decrease for hotel properties, a 51 percent decrease for retail properties, a 50 percent decrease for multifamily properties, a 49 percent decrease for office loans, and a 35 percent decrease for industrial properties.
Among investor types, the dollar volume of loans originated for depositories decreased by 73 percent year-over-year. There was a 55 percent decrease for investor-driven lenders, a 27 percent decrease in government sponsored enterprises (GSEs – Fannie Mae and Freddie Mac) loans, a 5 percent decrease for commercial mortgage-backed securities (CMBS), and a 4 percent decrease in the dollar volume of life insurance company loans.
MORTGAGE DEBT OUTSTANDING
The level of commercial mortgage debt outstanding has continued to increase despite a continued pullback in borrowing. A decline in sales transaction and refinance volumes has meant less new debt being extended, but it also means that fewer loans are paying off than in many earlier periods. The result is that debt levels continue to rise, but at a pace that is roughly half of what was seen last year.
The level of commercial/multifamily mortgage debt outstanding increased by $37.1 billion (0.8 percent) in the third quarter of 2023 to $4.63 trillion. Multifamily mortgage debt alone increased $26.8 billion (1.3 percent) to $2.05 trillion from the second quarter of 2023.

In the third quarter, agency and GSE portfolios and MBS saw the largest gains in dollar terms in their holdings of commercial/multifamily mortgage debt – an increase of $15.6 billion (1.6 percent). Life insurance companies increased their holdings by $10.4 billion (1.5 percent), bank and thrifts increased their holdings by $9.5 billion (0.5 percent), and federal government increased their holdings by $1.9 billion (2.1 percent).
Commercial banks continue to hold the largest share (38 percent) of commercial/multifamily mortgages at $1.8 trillion. Agency and GSE portfolios and MBS are the second-largest holders of commercial/multifamily mortgages (21 percent) at $986 billion. Life insurance companies hold $702 billion (15 percent), and CMBS, CDO another ABS issues hold $593 billion (13 percent).
LOAN PERFORMANCE
The delinquency rate for loans backed by office properties now exceeds those of loans backed by retail and hotel properties, while the delinquency rates for multifamily and industrial property loans remain below one percent.
Commercial property markets are working through challenges stemming from uncertainty about some properties’ fundamentals, a lack of transparency into where current property values are, and higher and volatile interest rates. The result has been a slow and steady uptick in delinquency rates, concentrated among loans facing more of those challenges.
- 97.3% of outstanding loan balances were current or less than 30 days late at the end of the third quarter, down from 97.7% at the end of the second quarter of 2023.
o 2.2% were 90+ days delinquent or in REO, up from 1.7% the previous quarter.
o 0.2% were 60-90 days delinquent, unchanged from the previous quarter.
o 0.3% were 30-60 days delinquent, down from 0.4%.
- Loans backed by office properties drove the increase.
o 5.1% of the balance of office property loans were delinquent, up from 4.0% at the end of last quarter.
o 5.0% of the balance of retail loan balances were delinquent, up from 4.9%.
o 4.9% of the balance of lodging loans were 30 days or more delinquent, down from 5.3%.
o 0.9% of multifamily balances were delinquent, up from 0.7%.
o 0.6% of the balance of industrial property loans were delinquent, down from 0.8%.

Every major capital source saw delinquency rates rise, driven by higher interest rates, changes in some property market fundamentals, and uncertainty about property values. CRE market activity remains muted, further complicating the situation.
Based on the unpaid principal balance (UPB) of loans, delinquency rates for each group at the end of the third quarter of 2023 were as follows:
- Banks and thrifts (90 or more days delinquent or in non-accrual): 0.85 percent, an increase of 0.18 percentage points from the second quarter of 2023;
- Life company portfolios (60 or more days delinquent): 0.32 percent, an increase of 0.18 percentage points from the second quarter of 2023;
- Fannie Mae (60 or more days delinquent): 0.54 percent, an increase of 0.17 percentage points from the second quarter of 2023;
- Freddie Mac (60 or more days delinquent): 0.24 percent, an increase of 0.03 percentage points from the second quarter of 2023; and
- CMBS (30 or more days delinquent or in REO): 4.26 percent, an increase of 0.44 percentage points from the second quarter of 2023.

CRE markets are large and heterogeneous. MBA data shows wide differences in mortgage performance by property type. Deal vintage, term, market, and a host of other factors also play into which loans are facing pressure. These differences are likely to remain important in the year ahead.