Mortgage Application Payments Increased 2.4 Percent to $2,184 in February
March 28, 2024
Share to
WASHINGTON, D.C. (March 28, 2024) – Homebuyer affordability declined in February, with the national median payment applied for by purchase applicants increasing to $2,184 from $2,134 in January. This is according to the Mortgage Bankers Association's (MBA) Purchase Applications Payment Index (PAPI), which measures how new monthly mortgage payments vary across time – relative to income – using data from MBA’s Weekly Applications Survey (WAS).
“Homebuyer affordability conditions declined further in February as recent economic data on jobs and inflation continue to keep mortgage rates elevated to around 7 percent,” said Edward Seiler, MBA’s Associate Vice President, Housing Economics, and Executive Director, Research Institute for Housing America. “Challenging affordability conditions and low housing supply are keeping some prospective homebuyers on the sidelines this spring. The eventual, expected decline in rates in the coming months will hopefully spur new activity in the housing market.”
An increase in MBA’s PAPI – indicative of declining borrower affordability conditions – means that the mortgage payment to income ratio (PIR) is higher due to increasing application loan amounts, rising mortgage rates, or a decrease in earnings. A decrease in the PAPI – indicative of improving borrower affordability conditions – occurs when loan application amounts decrease, mortgage rates decrease, or earnings increase.
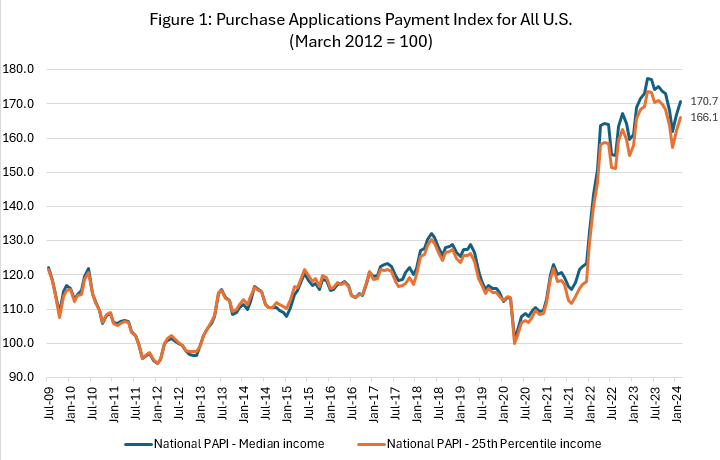
The national PAPI (Figure 1) increased 2.4 percent to 170.7 in February from 166.8 in January. Median earnings were up 4.8 percent compared to one year ago, and while payments increased 6.0 percent, the strong earnings growth means that the PAPI is up 1.1 percent on an annual basis. For borrowers applying for lower-payment mortgages (the 25th percentile), the national mortgage payment increased to $1,473 in February from $1,438 in January.
The Builders’ Purchase Application Payment Index (BPAPI) showed that the median mortgage payment for purchase mortgages from MBA’s Builder Application Survey increased to $2,534 in February from $2,501 in January.
Additional Key Findings of MBA's Purchase Applications Payment Index (PAPI) – February 2024
- The national median mortgage payment was $2,184 in February—up $50 from January. It is up $123 from one year ago, equal to a 6.0% increase.
- The national median mortgage payment for FHA loan applicants was $1,872 in February, up from $1,830 in January and up from $1,707 in February 2023.
- The national median mortgage payment for conventional loan applicants was $2,194, up from $2,147 in January and up from $2,117 in February 2023.
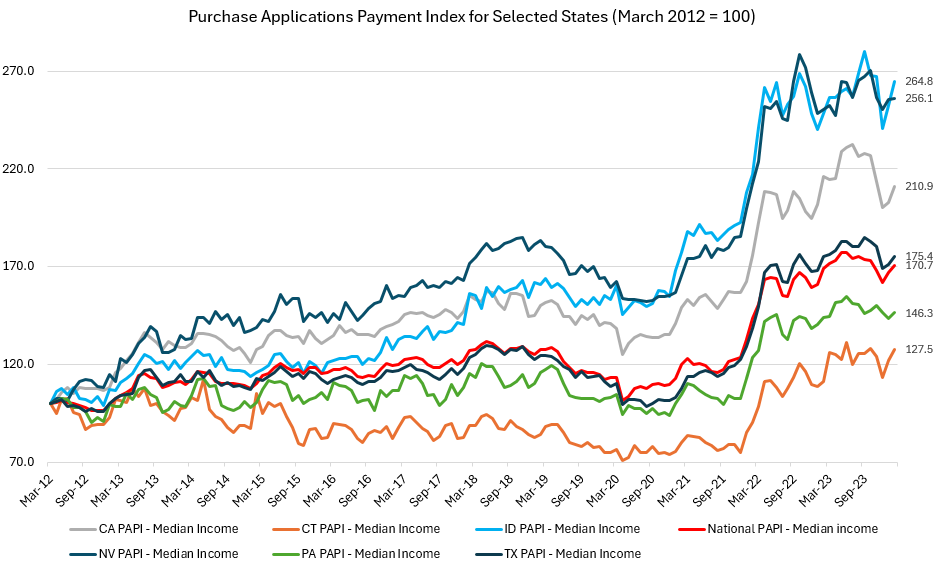
- The top five states with the highest PAPI were: Idaho (264.8), Nevada (256.1), Arizona (223.8), Florida (221.8), and Utah (216.3).
- The top five states with the lowest PAPI were: Louisiana (127.4), Connecticut (127.6), Vermont (130.0), New York (130.2), and Alaska (130.6).
- Homebuyer affordability decreased for Black households, with the national PAPI increasing from 163.1 in January to 166.9 in February.
- Homebuyer affordability decreased for Hispanic households, with the national PAPI increasing from 159.3 in January to 163.1 in February.
- Homebuyer affordability decreased for White households, with the national PAPI increasing from 170.2 in January to 174.2 in February.
About MBA’s Purchase Applications Payment Index
The Mortgage Bankers Association’s Purchase Applications Payment Index (PAPI) measures how new mortgage payments vary across time relative to income. Higher index values indicate that the mortgage payment to income ratio (PIR) is higher than in a month where the index is lower. Contrary to other affordability indexes that make multiple assumptions about mortgage underwriting criteria to estimate mortgage payment level, PAPI directly uses MBA’s Weekly Applications Survey (WAS) data to calculate mortgage payments.
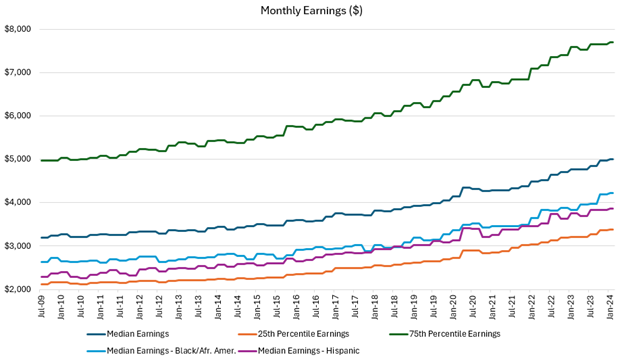
PAPI uses usual weekly earnings data from the U.S. Bureau of Labor Statistics’ Current Population Survey (CPS). Usual weekly earnings represent full-time wage and salary earnings before taxes and other deductions and include any overtime pay, commissions, or tips usually received. Note that data are not seasonally adjusted.
MBA’s Builders’ Purchase Application Payment Index (BPAPI) uses MBA’s Builder Application Survey (BAS) data to create an index that measures how new mortgage payments vary across time relative to income, with a focus exclusively on newly built single-family homes. As with PAPI, higher index values indicate that the mortgage payment to income ratio (PIR) is higher than in a month where the index is lower. To create BPAPI, principal and interest payment amounts are deflated by the same earnings series as in PAPI.
The rent data series calculated for MBA’s national mortgage payment to rent ratio (MPRR) comes from the U.S. Census Bureau’s Housing Vacancies and Homeownership (HVS) survey’s median asking rent. The HVS data is quarterly, and as such, the mortgage payment to rent ratio will be updated quarterly. The HVS data is quarterly, and as such, the mortgage payment to rent ratio will be updated quarterly. MPRR data was not included in the February 2024 data.
For additional information on MBA’s Purchase Applications Payment Index, click here.