Blog Posts
-
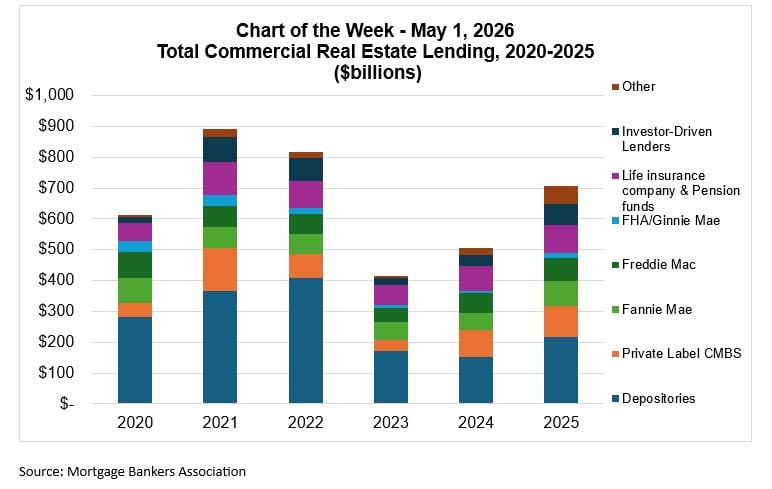 Chart of the Week: Total CRE Lending, 2020-2025
Based on the Mortgage Bankers Association’s (MBA) 2025 Commercial/Multifamily Annual Origination Volume Summation report, the commercial real estate lending market demonstrated meaningful recovery in 2025, with total origination volume reaching approximately $706 billion. This was a notable 40% increase over 2024's $505 billion and significantly outpaced the market low experienced in 2023. While 2025 volume has not yet returned to the peak levels seen in 2021 or 2022, the rebound in 2025 signals renewed lender confidence and improving market conditions across most capital source categories.
-
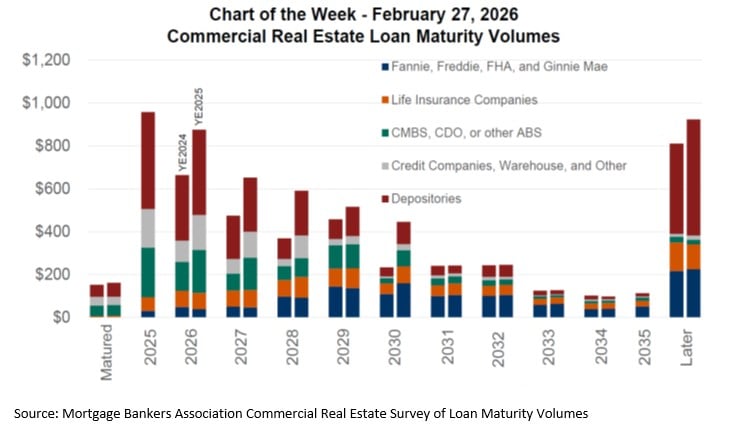 Chart of the Week: Commercial Real Estate Loan Maturity Volumes
Seventeen percent ($875 billion) of the $5.0 trillion of outstanding commercial mortgages held by lenders and investors is scheduled to mature in 2026, a 9 percent decrease from the $957 billion that was scheduled to mature in 2025. This is according to the Mortgage Bankers Association’s (MBA) 2025 Commercial Real Estate Survey of Loan Maturity Volumes.
-
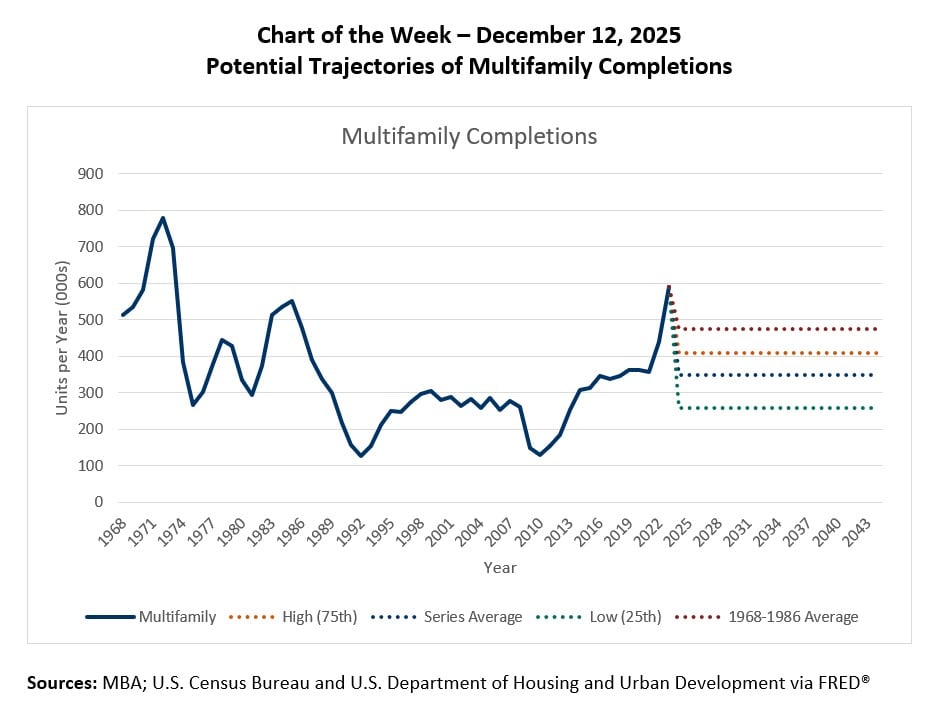 Chart of the Week: Potential Trajectories of Multifamily Completions
Developers have been building many apartment units over the past several years. We expect the pace of development to slow in the years ahead, given declining fundamentals including falling rents, rising vacancies, and increasing delinquencies in the multifamily sector.
-
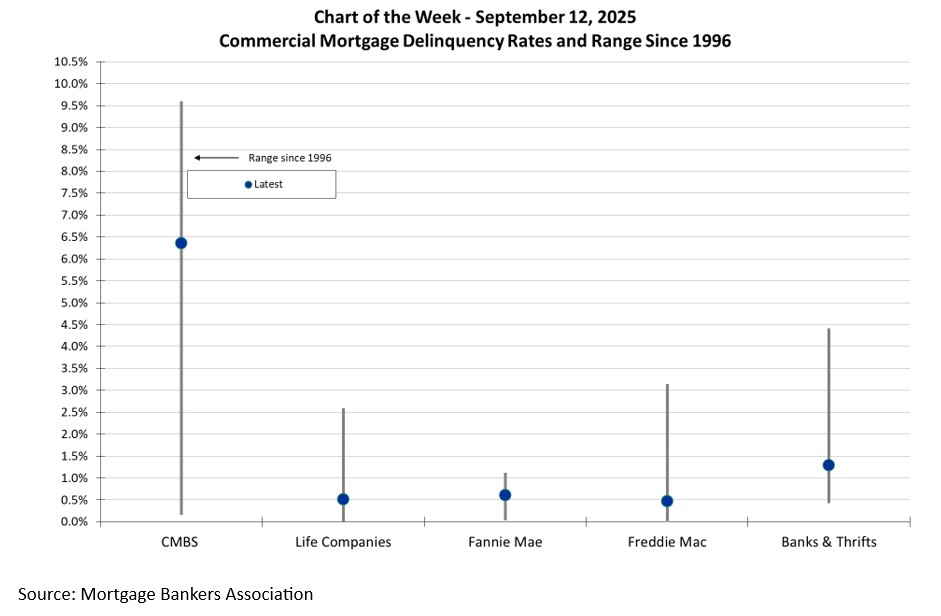 Chart of the Week: Commercial Mortgage Delinquency Rates and Range Since 1996
Commercial mortgage delinquencies rose in the most recent quarter, with increases recorded across most major capital sources. While the specific drivers vary by loan type and property sector, the trend underscores continued stress in commercial real estate, particularly within office and multifamily.
-
 Chart of the Week: Total Commercial Real Estate lending, 2020-2024
From 2020 to 2024, commercial and multifamily mortgage originations experienced notable shifts across investor types. The market peaked in 2021, driven by heightened activity across nearly all sectors, before experiencing a sharp decline in 2023. A modest rebound followed in 2024.
-
 Chart of the Week: Commercial/Multifamily Mortgage Debt Outstanding
Total commercial and multifamily mortgage debt outstanding increased by 3.7% year-over-year, rising from $4.62 trillion in Q4 2023 to $4.79 trillion in Q4 2024. This growth reflects continued investment in commercial real estate, with sector-specific variations in debt allocation.
-
 Chart of the Week: Commercial Real Estate Loan Maturity Volumes
Twenty percent ($957 billion) of $4.8 trillion of outstanding commercial mortgages held by lenders and investors will mature in 2025, a 3 percent increase from the $929 billion that matured in 2024, according to the Mortgage Bankers Association’s 2024 Commercial Real Estate Survey of Loan Maturity Volumes.
-
2024 Q3 Databook
The US economy continued its hot streak during the third quarter. Real gross domestic product grew at a real seasonally adjusted annual rate (SAAR) of 3.1 percent, following a rise of 3.0 percent in Q2. Consumers were key to the growth, with personal consumption growing at a real SAAR of 3.7 percent. Growth in business investment in equipment and intellectual property slightly outpaced the fall-off in investment in residential and non-residential property.
-
2024 Q2 Databook
After growing at a seasonally adjusted annual rate of 1.4 percent during the first quarter of 2024, the US real gross domestic product grew at 3.0 percent during the second quarter. The growth was driven by increases in consumer spending, private inventory investment, and nonresidential fixed investment.
-
 Chart of the Week: State and Local Building Performance Standards
Efforts to reduce carbon emissions related to commercial real estate have gone local, with the Biden Administration establishing a National Building Performance Standards (BPS) Coalition to help promote and facilitate state and municipal action.
-
2024 Q1 Databook
The US economy continues to show strength, albeit with (long-expected) moderation in some areas. Real gross domestic product grew at a seasonally adjusted annual rate of 1.3 percent in Q1, down from 2023 growth rates of 2.2 percent in Q1, 2.1 percent in Q2, 4.9 percent in Q3 and 3.4 percent in Q4. Consumer spending on services continued to be a key driver – growing at a 3.9 percent real annual pace during Q1. Consumer spending on goods fell at a 1.9 percent pace.
-
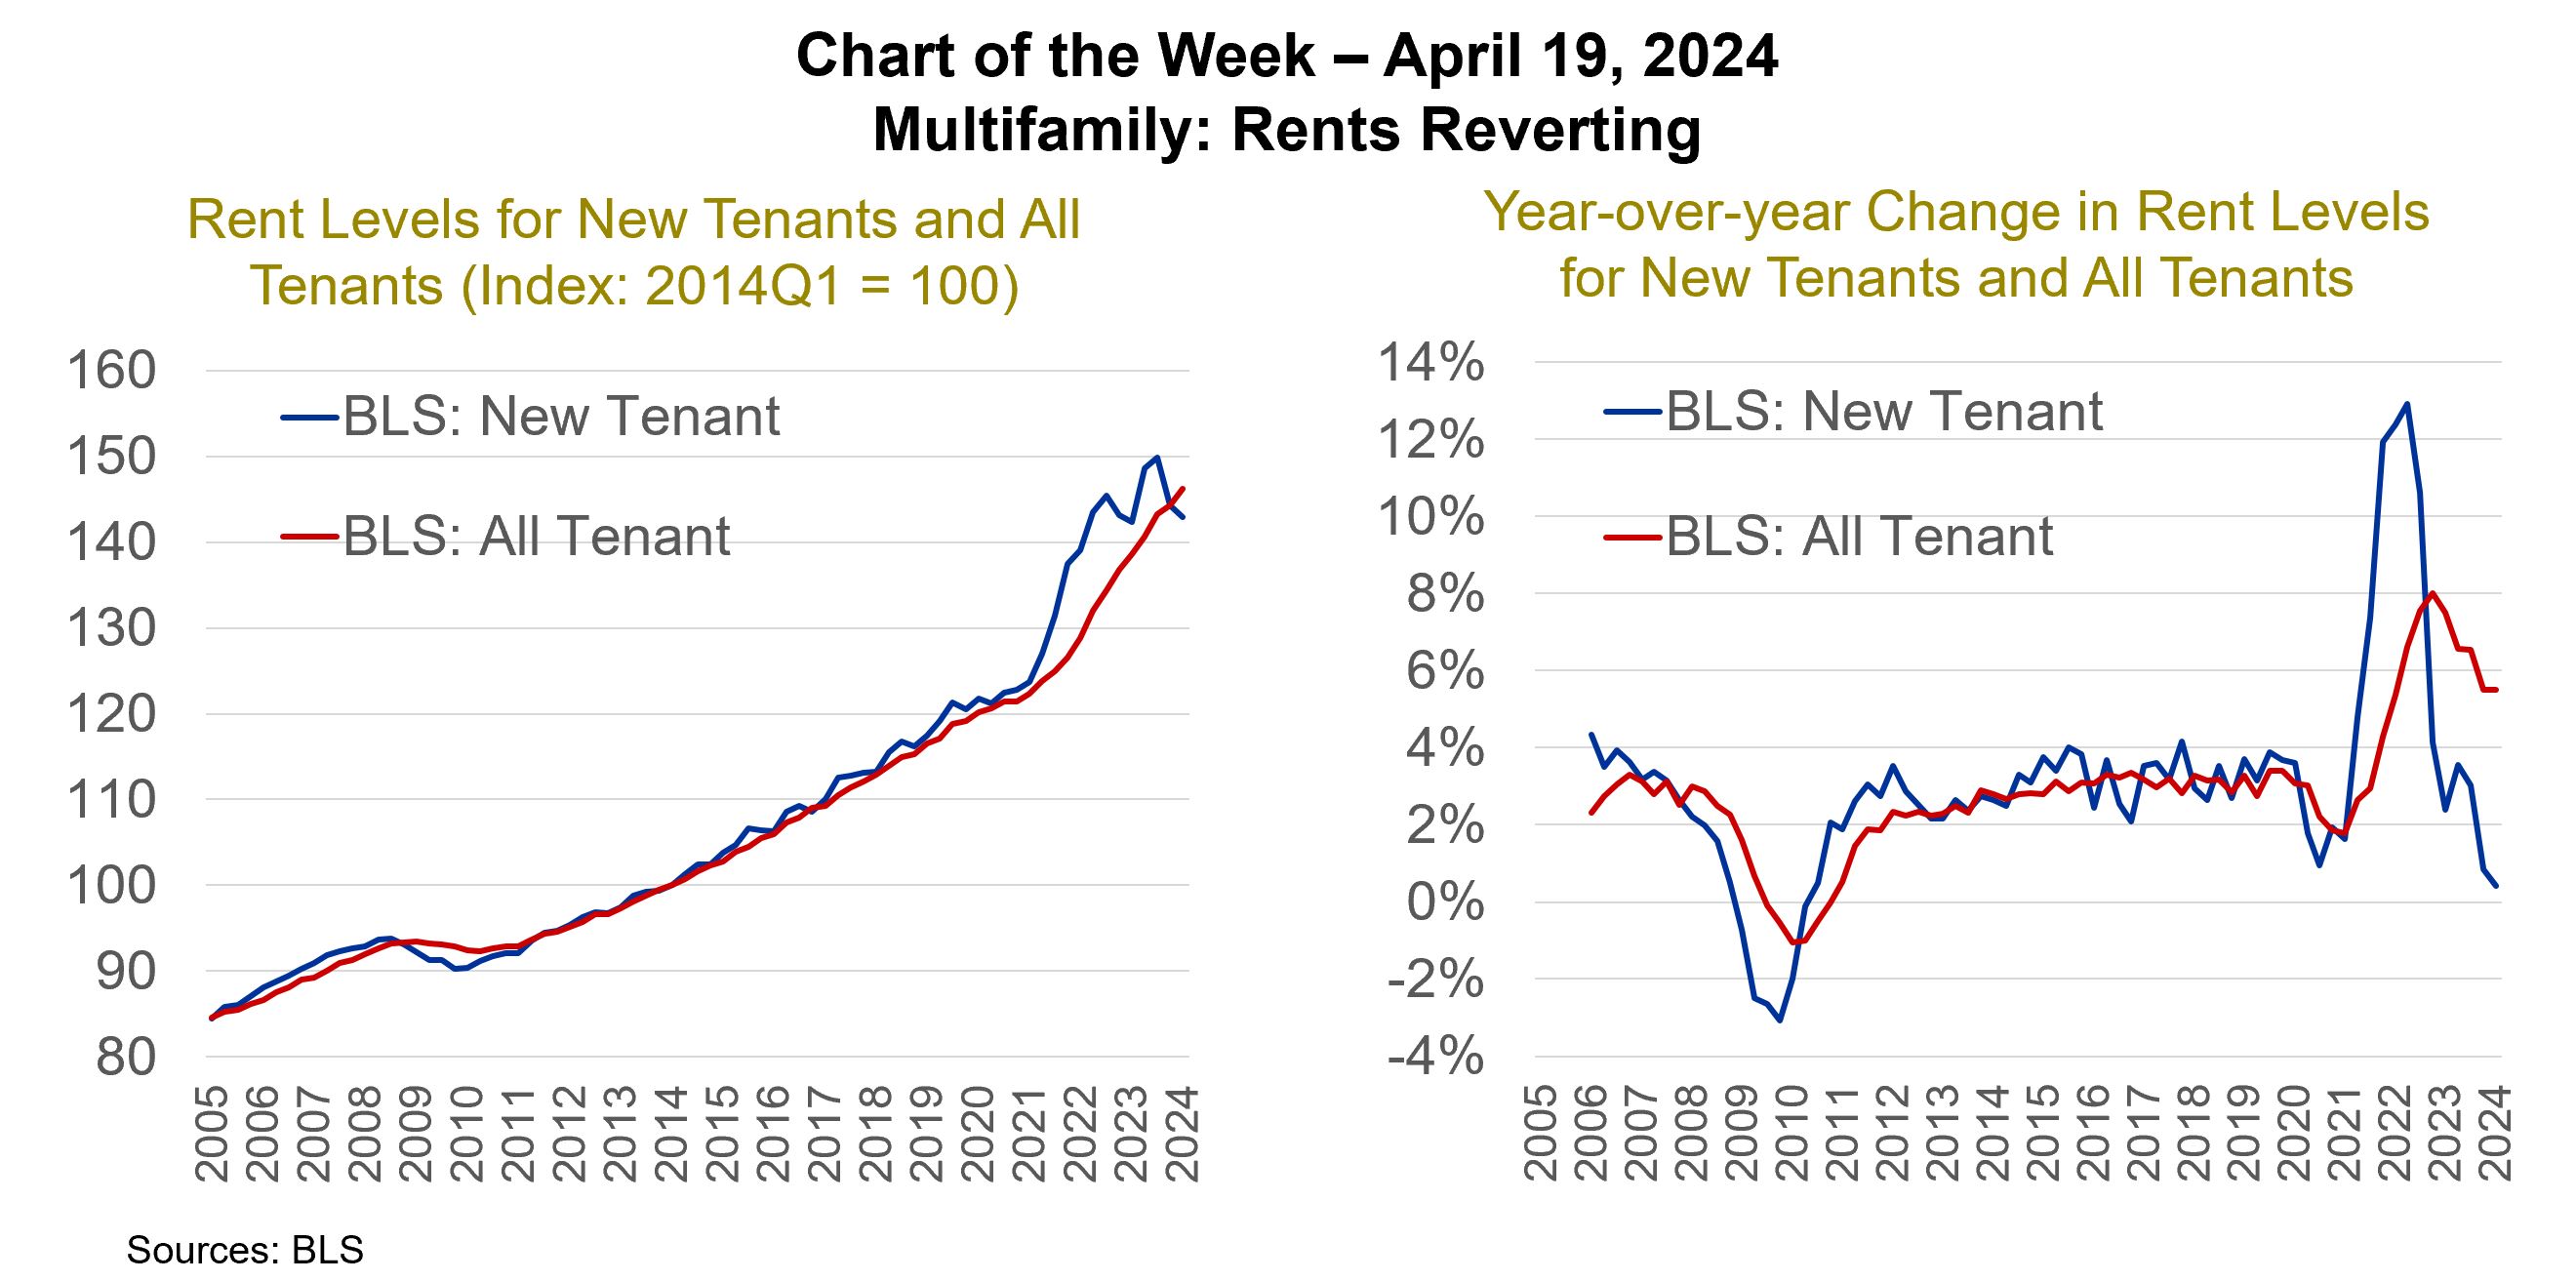 Chart of the Week: Multifamily - Rents Reverting
The pandemic did a number on the housing market. Rental markets were already stretched from years of underdevelopment that followed the Great Financial Crisis, while a surge of Millennials was just entering their formative renting years. The result was falling multifamily vacancy rates, which dropped from an all-time high of 13.1 percent at the end of 2009 to 7.0 percent at the end of 2015. Rents followed suit, rising steadily between 2 and 4 percent per year from 2012 to 2020.
-
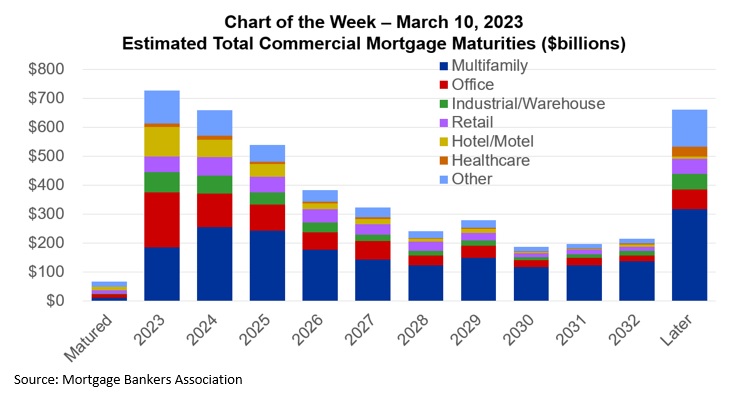 Chart of the Week: Estimated Total Commercial Mortgage Maturities
At MBA’s CREF Convention in San Diego last month, we released the results of our annual survey of upcoming commercial and multifamily mortgage maturities. The survey collects information directly from loan servicers on when the loans they service mature. As in past years, the numbers we released covered loans held by non-bank lenders—including those guaranteed by Fannie Mae, Freddie Mac, and FHA, as well as those held by life companies, included in commercial mortgage-backed securities (CMBS), made by investor-driven lenders like debt-funds, mortgage REITs, and other credit companies. While the information we collect covers essentially all the loans in those groups, it has typically covered only a sample of loans held by banks. This year’s survey, however, collected information on $400 billion of bank-held commercial and multifamily mortgages—23 percent of the outstanding universe. Using this year’s survey results, for the first time we are expanding our loan maturity analysis to include an estimate of the maturity profile of all commercial and multifamily mortgages—including the more than $1.7 trillion on bank balance sheets.